Journal of Pharmaceutical and Biomedical Analysis 40 (2006) 981–986
HPLC determination of lincomycin in premixes and feedstuffs with
solid-phase extraction on HLB OASIS and LC–MS/MS confirmation
Michal Douˇsa , Zdenˇek Sikaˇc , Michal Halama , Karel Lemr
a Ecochem, a.s. Praha, Dolejˇskova 3, 182 00 Praha, Czech Republic
b Central Institute for Supervising and Testing in Agriculture, NRL-RO Praha, Za Opravnou 4, 150 06 Praha 5, Czech Republic
c Department of Analytical Chemistry, Palack´y University, Tˇr. Svobody 8, 771 46 Olomouc, Czech Republic
Received 30 May 2005; received in revised form 27 July 2005; accepted 28 July 2005
Abstract
A rapid clean-up procedure based on solid-phase extraction (SPE) and HPLC determination of lincomycin in premixes with UV detection
is described. After extraction of lincomycin from premix with extraction solvent the extract is applied to OASIS HLB column treated withmethanol and water. Lincomycin is eluted with methanol and effluent is analysed on analytical column (phenyl) using mobile phase consists 0.2%phosphoric acid in water and acetonitrile (875:125, v/v). Detection is performed at 208 nm. Quantitation is carried out using external standard. The mean recovery of lincomycin was 105.0 ± 7.3%, in concentration range of 250–750 mg kg−1, and 99.8 ± 3.7%, in concentration range of10,000–150,000 mg kg−1. The limit of determination, based on a signal-to-noise ratio of 10:1, was 5.2 mg kg−1. LC–MS/MS confirmation oflincomycin is also presented. Identification was performed by monitoring two pairs of multiple reaction monitoring ions from the parent ions (m/z407.2 → 126.1 and 407.2 → 359.2) at the defined retention time window and by matching of the specific tolerance of relative abundance of majorions as stated in the European Union Commission Decision 2002/657/EC. 2005 Elsevier B.V. All rights reserved. Keywords: HPLC determination; LC–MS/MS confirmation; Lincomycin; Premix; Validation
1. Introduction
considerable expenditure of time and specialized skills. Micro-biological and TLC methods showed poor sensitivity, accuracy
Lincomycin [methyl 6,8-dideoxy-6{[(1-methyl-4-propyl-
and selectivity, and therefore nowadays are used mainly column
2-pyrrolidyl)carbonyl]amino}-1-thio-d-erythro-α-d-galacto-
separation techniques. Gas chromatographic procedures require
octapyranoside] is a sulfur-containing pyranoside broad-
elaborate extraction and derivatization steps (pre-column deriva-
spectrum antibiotic synthesized by Streptomycin lincolnensis
which shows in vitro and in vivo activity comparable
In the literature, there are many HPLC methods with ultravi-
to that of erythromycin against Staphylococci, Streptococci,
and Diplococci Its chemical structure was shown by
determination of lincomycin in food of animal origin and phar-
Hoeksema et al. It is used in both human and veterinary
maceutical dosage forms has only a weak UV
absorbance in the low wavelength range (210 nm), and with a few
Traditionally, lincomycin in complete feeds, supplements,
exceptions with photometric detection does not
premixes and veterinary preparations is determined by microbio-
allow the sensitive determination of lincomycin in complicated
logical assay thin-layer chromatography owever,
matrix. Determination of lincomycin in fermentation beers using
it is very difficult to differentiate lincomycin from other sub-
ion-pair reversed-phase LC on octylsilica gel with UV detection
stances using microbiological methods, which moreover require
at 214 nm was reported too Sulfur-containing antibioticsthat do not contain fully oxidized sulfur can be detected elec-trochemically. The electrochemical detection process for sulfur
compounds on noble metal electrode surfaces has been described
Corresponding author. fax: +420 286 587 112.
by LaCourse and co-workers for quantitation
E-mail addresses: [email protected] (M. Douˇsa),
[email protected] (M. Halama), [email protected] (K. Lemr).
of lincomycin residues in tissues by ion-pair reversed-phase LC
0731-7085/$ – see front matter 2005 Elsevier B.V. All rights reserved. doi:10.1016/j.jpba.2005.07.041
M. Douˇsa et al. / Journal of Pharmaceutical and Biomedical Analysis 40 (2006) 981–986
with electrochemical detection highly selective for lin-
The mobile phase for MS–MS experiments had the fol-
lowing composition acetonitrile–water–formic acid (125:875:1,
To date, no report has been published using such method
v/v) and separation was performed on a 150 mm × 4.6 mm, 4 m
for animal premixes. The purpose of this study was to develop
Phenomenex Synergi Polar-RP Column (Phenomenex, USA).
a rapid, simple and sensitive quantitative HPLC method for
The flow rate was 0.5 ml min−1, injection volume was 5 l.
determination of lincomycin in premixes using a phenyl col-umn for chromatographic separation followed by UV detection
at 208 nm. Since at this region many UV-absorbing componentspresented in analyzed samples could interfere, the selectivity of
The standard of lincomycin (Fluka, Germany; purity 102.7%)
was dissolved in acetonitrile at a concentration of 1000 mg l−1to obtain the standard stock solution. 2. Experimental
The real samples of premixes and compounded feeds were
Solvents, acetonitrile and methanol, were of HPLC grade
homogenized and grinded to particles of 0.5 mm and less. A
(Merck, Germany). Water purified on Milli-Q system (Milli-
portion (from 1.0 to 2.5 g of premix sample and 10.0 g of com-
pore, USA) was used. Other chemicals were of analytical grade.
pounded feed sample) was weighed into a 100-ml volumetric
Extraction solvent was made by combining 950 ml water and
flask, 80 ml extraction solvent was added, and this mixture was
50 ml methanol. Carrez solution I was prepared by dissolution
shortly shaken by hand. The sample was extracted for 10 min on
of 21.9 g dehydrated zinc acetate in water, then 3 ml glacial acetic
a horizontal shaker and then for 5 min in ultrasonic bath. Dis-
acid was added and solution was diluted to 100 ml with water.
solved proteinanceous substances were precipitated with Carrez
Carrez solution II was prepared by dissolution of 10.6 g potas-
solution I (1 ml) and Carrez solution II (1 ml). This mixture was
shortly shaken by hand and volumetric flask was filled to volume
The extracts were cleaned up using separation unit Baker
SPE 12G System (J.T. Baker, USA) on OASIS HLB Cartridge
The preconcentration was performed on an OASIS HLB Car-
tridge column. After filtration, 1–5 ml of filtrate was applied onan OASIS HLB SPE column (previously activated with 5 mlmethanol and 5 ml water) and the cartridge was washed with
2 ml of extraction solvent and with 2 ml of water. The SPE col-umn was dried under vacuum for 30 s, and then lincomycin was
Sample extraction was performed on laboratory horizontal
eluted with 5 ml of methanol, collected in a 25-ml volumetric
shaker. All chromatographic experiments were carried out using
flask. The volumetric flask was filled to the mark with 0.2%
a liquid chromatograph system consisting of Alliance 2695 and
phosphoric acid. The solution was injected into the liquid chro-
PDA detector W2996 (all Waters, USA). The system was con-
matograph. If necessary the extract solution was filtered through
trolled by data station PC Compaq using Millennium software
a 0.45 m membrane filter before injection.
The HPLC/MS equipment consisted of a Waters Alliance
3. Results and discussion
2690 system (Waters, UK), connected to a Micromass QuattroPremier Mass Spectrometer with Z SprayTM API source oper-
3.1. Development and optimization of the HPLC method
ating in positive ion electrospray (ESI) mode (Micromass UK,UK). The MS system was controlled by the Masslynx software
Early method development highlighted limitations placed on
the chromatography due to the physico-chemical properties oflincomycin. Lincomycin UV absorbance is too weak for quanti-
tation above 208 nm, so the possible mobile phase compositionwas limited. Hence, HPLC method development was limited
HPLC separations were performed on a 150 mm × 4.6 mm,
to an acetonitrile/phosphoric acid mobile phase using Polar-
4 m Phenomenex Synergi Polar-RP Column (Phenomenex,
RP Phenyl and RPAmide C16 columns at low UV wavelengths
USA) and on a 150 mm × 3.0 mm, 4 m RPAmide C16
and to variation of pH, temperature and volume fraction (ϕ) of
(Supelco, USA) as alternative column. The mobile phase was
organic solvent in mobile phase mixture.
875:125 (v/v) 0.2% phosphoric acid in water–acetonitrile and
The mobile phase was optimized to reach the capacity fac-
950:50 (v/v) 0.2% phosphoric acid in water–acetonitrile as alter-
tor k ≥ 1.5, theoretical plate number N ≥ 3000 and asymmetry
native mobile phase for RPAmide column. Mobile phases were
factor ta ≤ 1.4. The experimental parameters of optimized chro-
prepared by mixing volume to volume of the components. The
matographic method were determined using calibration solution
flow rate was 0.8 ml min−1, the detection wavelength 208 nm,
of standard (at concentration of 10 mg l−1).
the injection volume was 50 l, the column was thermostated at
The pH and ratio of acetonitrile to phosphoric acid were opti-
mized with the set conditions at 30 ◦C, 208 nm wavelength, 0.2%
M. Douˇsa et al. / Journal of Pharmaceutical and Biomedical Analysis 40 (2006) 981–986
phosphoric acid and flow rate 0.8 ml min−1 on a PhenomenexSynergi Polar-RP Phenyl column and on a RP Amide C16 col-umn. To the test robustness of developed method the pH ofmobile phase was always adjusted with potassium hydroxide(5 M) to pH 2.0, 2.25, 2.50, 2.75 and 3.00. The pH of mobilephase had no influence on retention of lincomycin and responseof UV detector in the studied range.
To evaluate the influence of organic solvent fraction in mobile
log k = log ka − mϕ
where ka is the (extrapolated) value of k for ϕ = 0 (in this case itcorresponds to retention in 0.2% phosphoric acid) and m is a con-stant for each solute calculated Eq. volume
Fig. 1. Chromatograms of lincomycin in real premix sample (content
fraction ϕ = 0.05–0.20 is consecutive: log k = 1.2313 − 5.9922ϕ
100,000 mg kg−1); A, extract of real premix sample; B, blank extract. Capacity
(r = −0.9894) for Phenomenex Synergi Polar-RP Phenyl col-
factor k = 2.35, plate number N = 3500, asymmetry factor ta = 1.4.
umn. The calculated correlation coefficient r was poor, soEq. ve been re-calculated for narrower volume fraction
3.2. Linearity, limit of detection and limit of quantitationϕ = 0.075–0.15: log k = 1.2364 − 6.4460ϕ (r = −0.9983). Eq. for volume fraction ϕ = 0.025–0.10 using RPAmide C16 col-
A set of six standard solutions at the following concentra-
umn is consecutive: log k = 0.9827 − 6.7324ϕ (r = −0.9936).
tions was prepared: 0.2, 2.0, 4.0, 8.0, 20 and 60.0 mg l−1. Each
The above equations allow prediction of retention of lincomycin
of them was analyzed in duplicate. The calibration curve was
in studied chromatographic systems (for mentioned ranges of
constructed by plotting the peak area against the concentra-
tion and the calibration equation was calculated using linear
The effect of temperature on the retention in RP-HPLC has
regression analysis. It showed slope 28,163, y-intercept 4772
been previously examined, e.g., by Melander et al. The
and correlation coefficient of 0.9999 what indicates an excellent
expected temperature dependence of retention can be expressed
linearity. The calibration curve was prepared in range from 0.2
to 60 mg l−1, which is satisfactory with regard to actual contentof lincomycin in premixes.
The average limit of detection of lincomycin (based on
a detector signal-to-noise ratio 3:1) was 0.075 mg l−1; the
average limit of quantitation of lincomycin (based on a
S◦ are the standard enthalpy and standard
detector signal-to-noise ratio of 10:1) was 0.26 mg l−1. The
entropy in chromatography system, R the gas constant, V
found limit of detection and limit of quantitation correspond
to 1.5 and 5.2 mg kg−1, respectively, in a real feed sample
and A and B are the constants dependent on chromatographic
using the treatment described in the experimental section.
system. In presented study linear van’t Hoff plots have been
The baseline noise was measured using four different chro-
obtained over narrow temperature range (30–50 ◦C). The cal-
matograms of the blank feed extracts in the region of retention
culated Eq. for temperature range 30–50 ◦C is consec-
time of lincomycin using chromatographic software. All of
utive: ln k = −0.061 + 280.2/T (r = −0.9957) for Phenomenex
the above-presented limits were verified experimentally by
Synergi Polar-RP Phenyl column. Eq. the same tem-
measuring blank feed samples fortified with lincomycin (for
perature range using RP Amide C16 column is consecutive:
above calculated amounts). All calculated limits are sufficiently
log k = −1.149 + 782.1/T (r = −0.9916). The above equations
low with regard to expected amounts of lincomycin in real
allow prediction of retention of lincomycin in studied chromato-
graphic systems (for mentioned ranges of temperature). Thesuitable temperature for separation of lincomycin is 35 ◦C.
Using obtained information concerning to behavior of lin-
comycin in studied chromatographic systems the useful exper-
The system suitability test is performed to assure that the ana-
imental conditions were selected and separation of lincomycin
lytical method can be executed with the existing HPLC system.
from matrix components in a short analysis time (below 8 min)
A system suitability test of the chromatographic system was
was achieved. The optimal mobile phase contains 125 vol-
performed before each validation run. Five replicate injections
umes of acetonitrile and 875 volumes of 0.2% phosphoric
of a system suitability/calibration standard (at concentration of
acid. Typical chromatogram of an extract of premix ana-
10 mg l−1) were made. Area and retention time relative standard
lyzed under proposed chromatographic conditions is shown in
deviation, asymmetry factor ta and efficiency (as plate number
N) for the five injections were determined. For all samples anal-
M. Douˇsa et al. / Journal of Pharmaceutical and Biomedical Analysis 40 (2006) 981–986
yses, the asymmetry factor ta was ≤1.4, efficiency ≥ 3000 and
Results and statistical parameters for analyses of model compounded feed sam-ples (n = 6)
3.4. Optimization of sample preparation
Solid-phase extraction was used as an important step of
the sample preparation. The extraction solvent (5% methanol
in water) was tested as rinsing solvent to eliminate samplematrix components, which might interfere in HPLC determi-nation. The extraction solvent did not cause any loss of analyte
cd = (25.01 ± 123.74) + (0.9393 ± 0.2227)ce
during cartridge rinsing up to 5 ml of solvent volume. Quan-
and R2 = 0.9998. The first and second constants were not
titative elution of lincomycin from SPE cartridge is apparent
statistically different from zero and one, respectively. It can
after 5.0 ml of methanol. The reproducibility and recovery of
be concluded that analytical method gives accurate results for
solid-phase extraction was determined from five repetitions. The
reproducibility expressed as R.S.D. was 0.6% and recovery was98.8% for concentration of 8 mg l−1 of lincomycin.
The intermediate precision of the method was assessed during
2 days. On each day the same premix sample (110,000 mg kg−1)
was six times analyzed by different analysts at the same equip-
Model samples of premix were prepared to test the accu-
ment. The approximate lincomycin concentration in the ana-
racy of the developed method. Different amounts of lin-
lyzed solutions was about 45 mg l−1. Results are shown in
comycin were added to the mixture of subsequent compo-
ay ANOVA was carried out to determine statisti-
nents 60% wheat and 40% calcite to prepare samples with
cal difference between two sets of data. According to calculated
different concentration levels. For each level, six analyses
results, the difference between the sets was not statistically sig-
were performed. The results and statistical parameters are
nificant at 95% confidence level (Fvalue (1.247) < Fcrit (5.050)).
summarized in The average overall recovery atthe 10,000, 50,000, 100,000 and 150,000 mg kg−1 levels was
99.8% with a standard deviation of 3.7%. Determined con-tents (cd) were compared with expected ones (ce) using lin-
The developed method was verified on real samples of differ-
ear regression. The regression equation (significance level
ent commercial premixes. ws a comparison of assay
P = 0.95) was cd = (−47.49 ± 1129.8) + (1.004 ± 0.012)ce andR2 = 0.9999. The first and second constants were not statistically
different from zero and one, respectively. It can be concluded
that analytical method gives accurate results for premixes.
Model samples of feeds were prepared to test the accuracy
of the developed method. Different amounts of lincomycin
were added to the compounded feeds for pig to prepare
samples with different concentration levels. For each level,
six analyses were performed. The results and statistical
parameters are summarized in The average overall
recovery at 250, 500 and 750 mg kg−1 levels was 100.4%with a standard deviation of 4.2%. Determined contents
Results of assay lincomycin in four different commercial brands
were compared with expected ones (ce) using lin-
ear regression. The regression equation (significance level
Table 1Results and statistical parameters for analyses of model premix samples (n = 6)
M. Douˇsa et al. / Journal of Pharmaceutical and Biomedical Analysis 40 (2006) 981–986
values with declared contents in samples obtained from three
In HPLC parameters we used same chromatographic col-
umn and composition of mobile phase as HPLC-UV method,we changed the flow rate to 0.5 ml min−1 because it is moreoptimal for ESI ionization and we decreased injection volume
to 5 l due the higher sensitivity of MS instrument.
Identity of lincomycin was confirmed by the presence of two
UV detection at 208 nm has to be considered as non-selective
fragments (at m/z 126.1 and 359.2) from the precursor ion at the
and sometimes it can be necessary to carry out confirmation of
defined retention time window and matching of the specific toler-
presence of analyte in sample by mass spectrometry. Effective-
ance of relative abundance of the major ions as stated in the Com-
ness of ionization of the analyte was investigated by analyzing
mission Decision 2002/657/EC s illustrated in /z
an appropriate amount of the standard (50–100 ng ml−1)
126.1 corresponds to the 3-propyl-N-methylpyrrolidine ion (A)
under different modes of ionization (electrospray positive and
and m/z 359.2 is due to the loss of thiomethanol molecule (B)
negative, respectively). As the negative ionization mode did
from the respective parent ion of lincomycin. MS–MS method
not give significant signals for analyte, it was not selected for
could by used for quantitation especially for low concentration,
further experiments. The parent ion was used as the precursor
but for the feed sample in which the concentration of lincomycin
for formation of MRM fragments in tandem mass spectrometry.
is sufficient for HPLC-UV method, mainly we used MS–MS
Further MS–MS experiments were performed to generate the
for confirmation. Quantitation was based on the relative
major product ion fragments. The final MS conditions were
ratios of the summation of peak areas of major ions of the
achieved by optimizing of the capillary voltage, desolvation
analytes with reference to the respective ratios of the calibration
temperature, gas flow and ion-focussing potentials whilst con-
standards. The average limit of quantitation of lincomycin
tinuously infusing 0.4 g ml−1 standard solution at a flow rate of
(based on lowest positive signal) is 0.1 mg kg−1. w
the reconstructed MRM chromatogram that was obtained for
The following MS–MS parameters were used: capillary volt-
lincomycin in spiked control compounded feeds sample. The
age: 3.1 kV; cone voltage: 25 V; source temperature: 120 ◦C;
concentration of lincomycin in the spiked feed control was
desolvation temperature: 350 ◦C; collision energy: 24 eV; colli-
sion gas pressure: 2.3 × 10⁻³ mbar (N2).
Fig. 2. A tandem mass spectrum of lincomycin (100 ng ml−1 in 0.1% formic acid in water) with collision-induced dissociation of quasimolecular ion ([M + H]+ = 407)leading to daughter ions at m/z 126.1 and 359.2. M. Douˇsa et al. / Journal of Pharmaceutical and Biomedical Analysis 40 (2006) 981–986References
[1] J.C. Pechere, Pathol. Biol. 34 (1986) 119–122. [2] A.D. Argoudelis, J.A. Fox, D.J. Mason, Biochemistry 43 (1965)
[3] A.D. Argoudelis, D.J. Mason, Biochemistry 43 (1965) 704–709. [4] H. Hoeksema, B. Bamister, R.D. Birkenneyer, F. Kajan, B.J. Marcrlein,
F.A. McKellar, W. Schroeder, G. Siomp, R.R. Herr, J. Am. Chem. Soc. 86 (1964) 4223–4224.
[5] G.L. Stahl, D.D. Kratzer, J. Assoc. Off. Anal. Chem. 66 (1983) 597–601. [6] A.R. Barbiers, A.W. Neff, J. Assoc. Off. Anal. Chem. 59 (1976)
[7] A.W. Neff, R.W. Thomas, J. Assoc. Off. Anal. Chem. 61 (1978)
[8] J. Krzek, A. Kwiecien, M. Starek, A. Kierszniewska, W. Rzeszutko, J.
[9] L.W. Brown, J. Pharm. Sci. 63 (1974) 1597–1600.
Fig. 3. Reconstructed MRM chromatogram of ions (at m/z 359 and 126) for
[10] C.H. McMurray, W.J. Blanchflower, D.A. Rice, J. Assoc. Off. Anal.
control compounded feed fortified with 250 mg g−1 of lincomycin.
[11] R.L. Houtman, D.G. Kaiser, A.J. Taraszka, J. Pharm. Sci. 57 (1968)
4. Conclusion
[12] W. Luo, E.B. Hansen, C.Y. Ang, H.C. Thompson, J. AOAC Int. 79
The developed HPLC procedure allows short analysis (below
[13] J. Sz´unyog, E. Adams, K. Liekens, E. Roets, J. Hoogmartens, J. Pharm.
8 min) with satisfactory UV detection and it is convenient for
[14] D.W.M. Sin, C. Ho, Y.C. Wong, S.K. Ho, A.C.B. Ip, Anal. Chim. Acta
determination of lincomycin in premixes and feeds in con-
tent ranging from 250 to 150,000 mg kg−1. In comparison with
[15] T.S. Thompson, D.K. Noot, J. Calvert, S.F. Pernal, J. Chromatogr. A
described methods for determination of lincomycin, developed
HPLC method is very simple, rapid and enough sensitive for
[16] D.W.-M. Sin, Y.-C. Wong, A.C.-B. Ip, J. Pharm. Biomed. Anal. 34
determination in premixes and feeds without derivatization step.
[17] S. Vladimirov, L. Markovi´c, D. Agbab, D. ˇ
Elimination of interfering compounds, without loss of target ana-
J. Serb. Chem. Soc. 62 (1997) 1221–1225.
lyte, is achieved. Evaluation of method demonstrates satisfactory
[18] J.A. Orwa, F. Bosmans, S. Depuydt, E. Roets, J. Hoogmartens, J. Chro-
statistical parameters for its application to lincomycin determi-
nation in studied matrices. Liquid chromatography coupled with
[19] United States Pharmacopeia 23, United States Pharmacopeial Conven-
mass spectrometry is rapidly becoming the method of choice for
[20] P.A. Asmus, J.B. Landis, C.L. Vila, J. Chromatogr. 264 (1983) 241–244.
the determination of lincomycin in feeds. The use of confirma-
[21] W.R. LaCourse, G.S. Owens, Anal. Chim. Acta 307 (1995) 301–319.
tion ions (m/z 126 and 359) provides additional confidence in
[22] W.R. LaCourse, C.O. Dasenbrock, J. Pharm. Biomed. Anal. 19 (1999)
Preparation of samples in series and short chromatographic
[23] D.C. Johnson, W.R. LaCourse, Anal. Chem. 62 (1990) 589A–597A. [24] W. Luo, E.B. Hansen Jr., C.Y.W. Ang, H.C. Thompson Jr., J. Assoc.
run also offers the application of developed method in routine
Off. Anal. Chem. 79 (1996) 839–842.
[25] G.E. Berendsen, L. Galan L, J. Chromatogr. 196 (1980) 21–37. [26] K. Valko, L.R. Snyder, J. Chromatogr. A 656 (1993) 501–520. Acknowledgement
[27] W.R. Melander, C.A. Mannan, Cs. Horvath, Chromatographia 15 (1982)
[28] H. Colin, G. Guiochon, J. Chromatogr. 158 (1978) 183–189.
The financial support of this work by Ministry of Education
[29] European Union Commission Decision 2002/657/EC, Off. J. Eur. Com-
(MSM 6198959216), Czech Republic, is acknowledged.
Nanowires can detect molecular signs of cancer, scientists find Brightsurf Science News Ads by Google PSA Blood Test Elevated PSA Brightsurf RSS Science News Nanowires can detect molecular signs of Search BrightSurf.com Search Brightsurf Science cancer, scientists find Science News Article Resource Directory Use of minuscule devices to spot cancer m
Universidad Salvadoreña Alberto Masferrer Manual de Normas Nombre de la política: Norma de Estímulos a Investigadores. Código: Ámbito de Aplicación: Investigadores. Versión: Vigente a partir de: 22 de Julio de 2010. Página 1 de 2 Objetivo: Establecer los lineamientos para el otorgamiento de estímulos que favorezca la plena y permanente


 Journal of Pharmaceutical and Biomedical Analysis 40 (2006) 981–986
HPLC determination of lincomycin in premixes and feedstuffs with
solid-phase extraction on HLB OASIS and LC–MS/MS confirmation
Michal Douˇsa , Zdenˇek Sikaˇc , Michal Halama , Karel Lemr
a Ecochem, a.s. Praha, Dolejˇskova 3, 182 00 Praha, Czech Republic
b Central Institute for Supervising and Testing in Agriculture, NRL-RO Praha, Za Opravnou 4, 150 06 Praha 5, Czech Republic
c Department of Analytical Chemistry, Palack´y University, Tˇr. Svobody 8, 771 46 Olomouc, Czech Republic
Received 30 May 2005; received in revised form 27 July 2005; accepted 28 July 2005
Abstract
Journal of Pharmaceutical and Biomedical Analysis 40 (2006) 981–986
HPLC determination of lincomycin in premixes and feedstuffs with
solid-phase extraction on HLB OASIS and LC–MS/MS confirmation
Michal Douˇsa , Zdenˇek Sikaˇc , Michal Halama , Karel Lemr
a Ecochem, a.s. Praha, Dolejˇskova 3, 182 00 Praha, Czech Republic
b Central Institute for Supervising and Testing in Agriculture, NRL-RO Praha, Za Opravnou 4, 150 06 Praha 5, Czech Republic
c Department of Analytical Chemistry, Palack´y University, Tˇr. Svobody 8, 771 46 Olomouc, Czech Republic
Received 30 May 2005; received in revised form 27 July 2005; accepted 28 July 2005
Abstract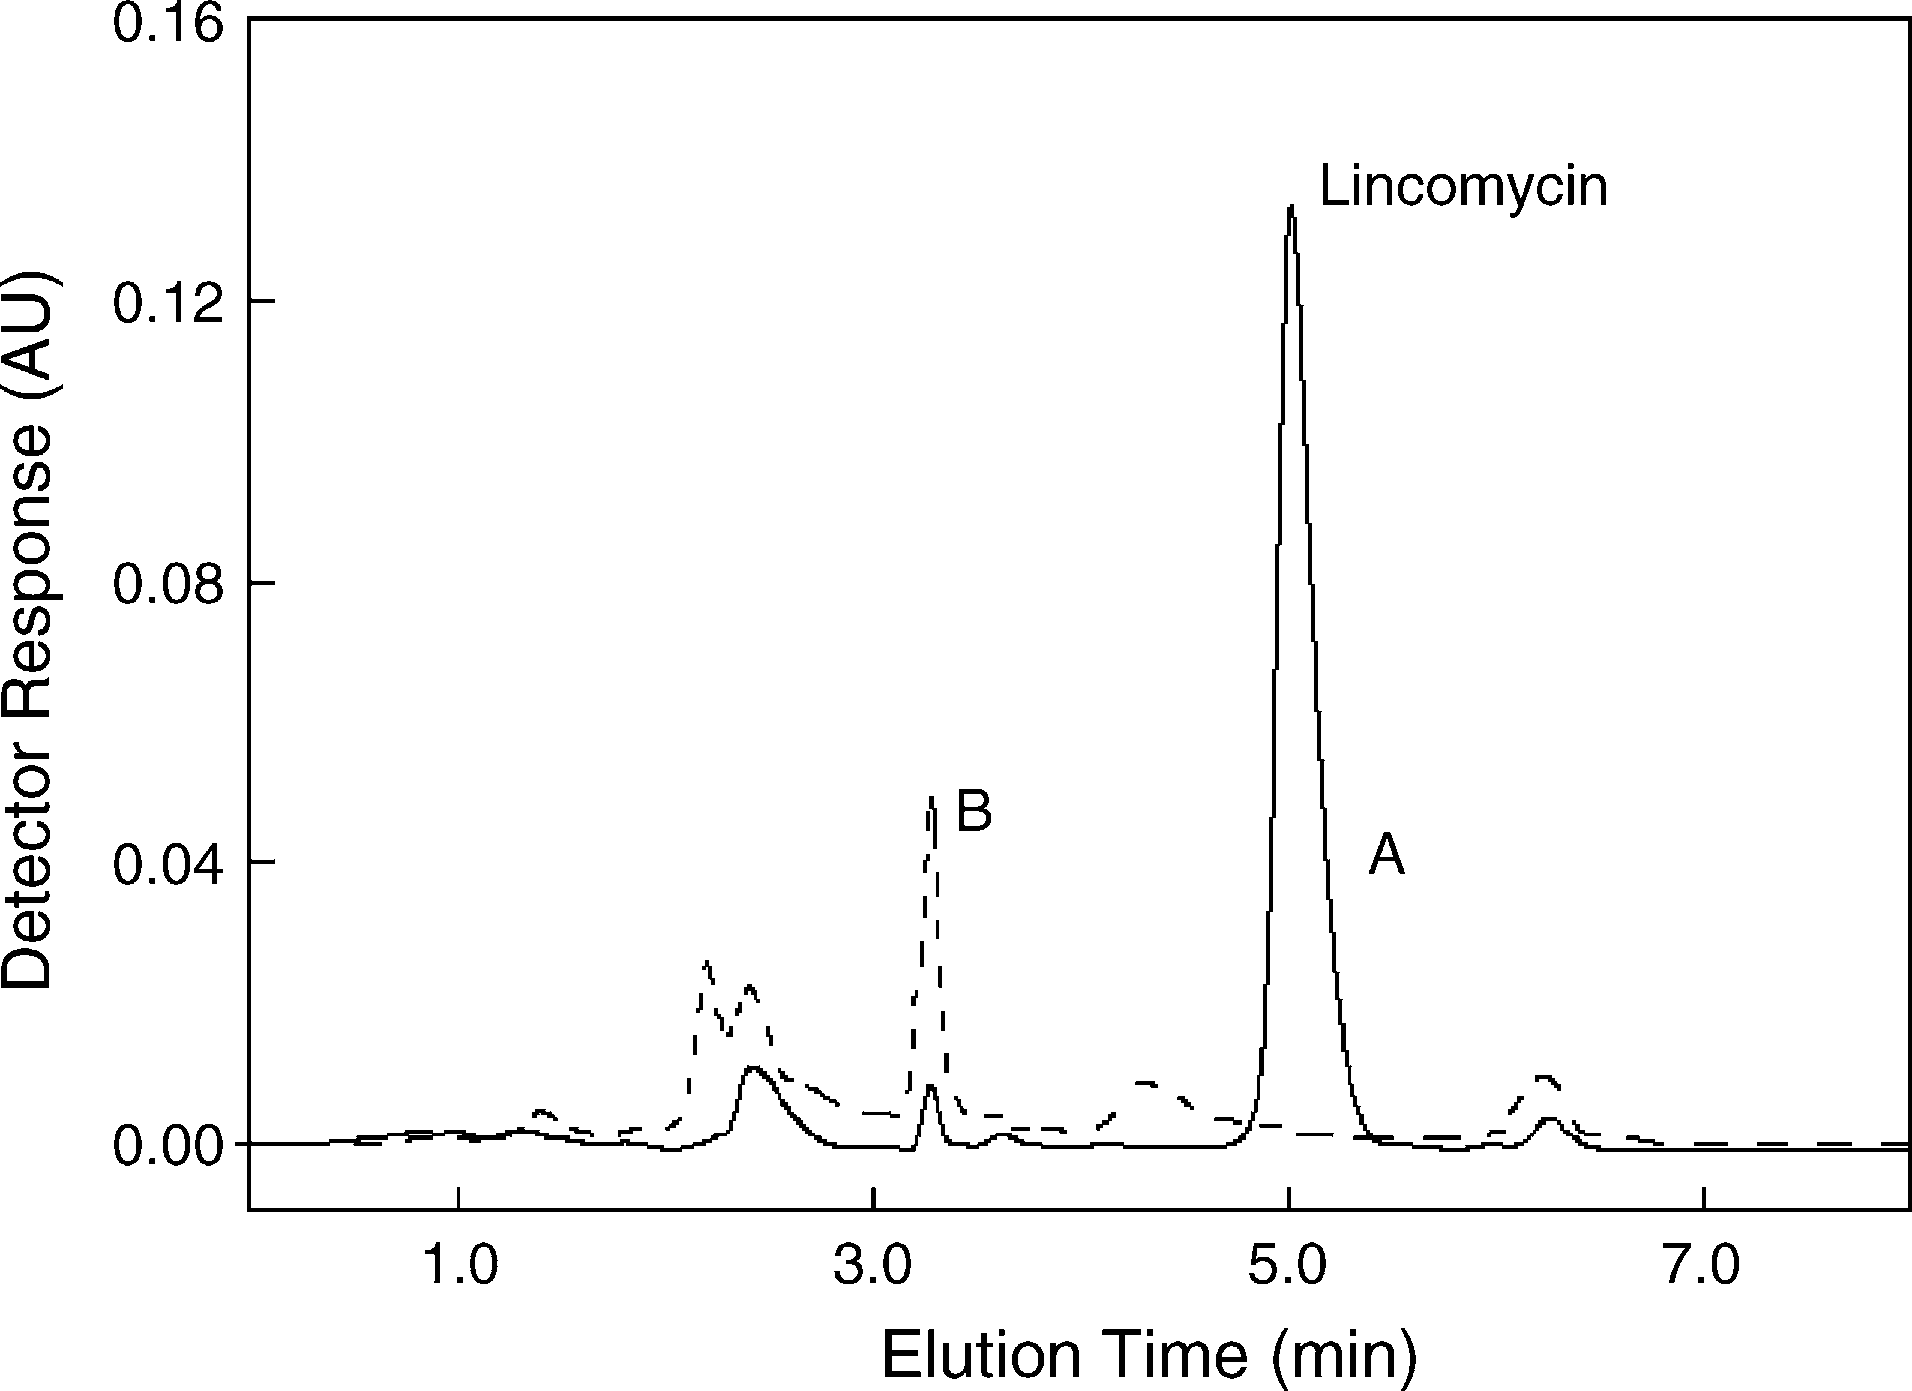 M. Douˇsa et al. / Journal of Pharmaceutical and Biomedical Analysis 40 (2006) 981–986
phosphoric acid and flow rate 0.8 ml min−1 on a PhenomenexSynergi Polar-RP Phenyl column and on a RP Amide C16 col-umn. To the test robustness of developed method the pH ofmobile phase was always adjusted with potassium hydroxide(5 M) to pH 2.0, 2.25, 2.50, 2.75 and 3.00. The pH of mobilephase had no influence on retention of lincomycin and responseof UV detector in the studied range.
M. Douˇsa et al. / Journal of Pharmaceutical and Biomedical Analysis 40 (2006) 981–986
phosphoric acid and flow rate 0.8 ml min−1 on a PhenomenexSynergi Polar-RP Phenyl column and on a RP Amide C16 col-umn. To the test robustness of developed method the pH ofmobile phase was always adjusted with potassium hydroxide(5 M) to pH 2.0, 2.25, 2.50, 2.75 and 3.00. The pH of mobilephase had no influence on retention of lincomycin and responseof UV detector in the studied range.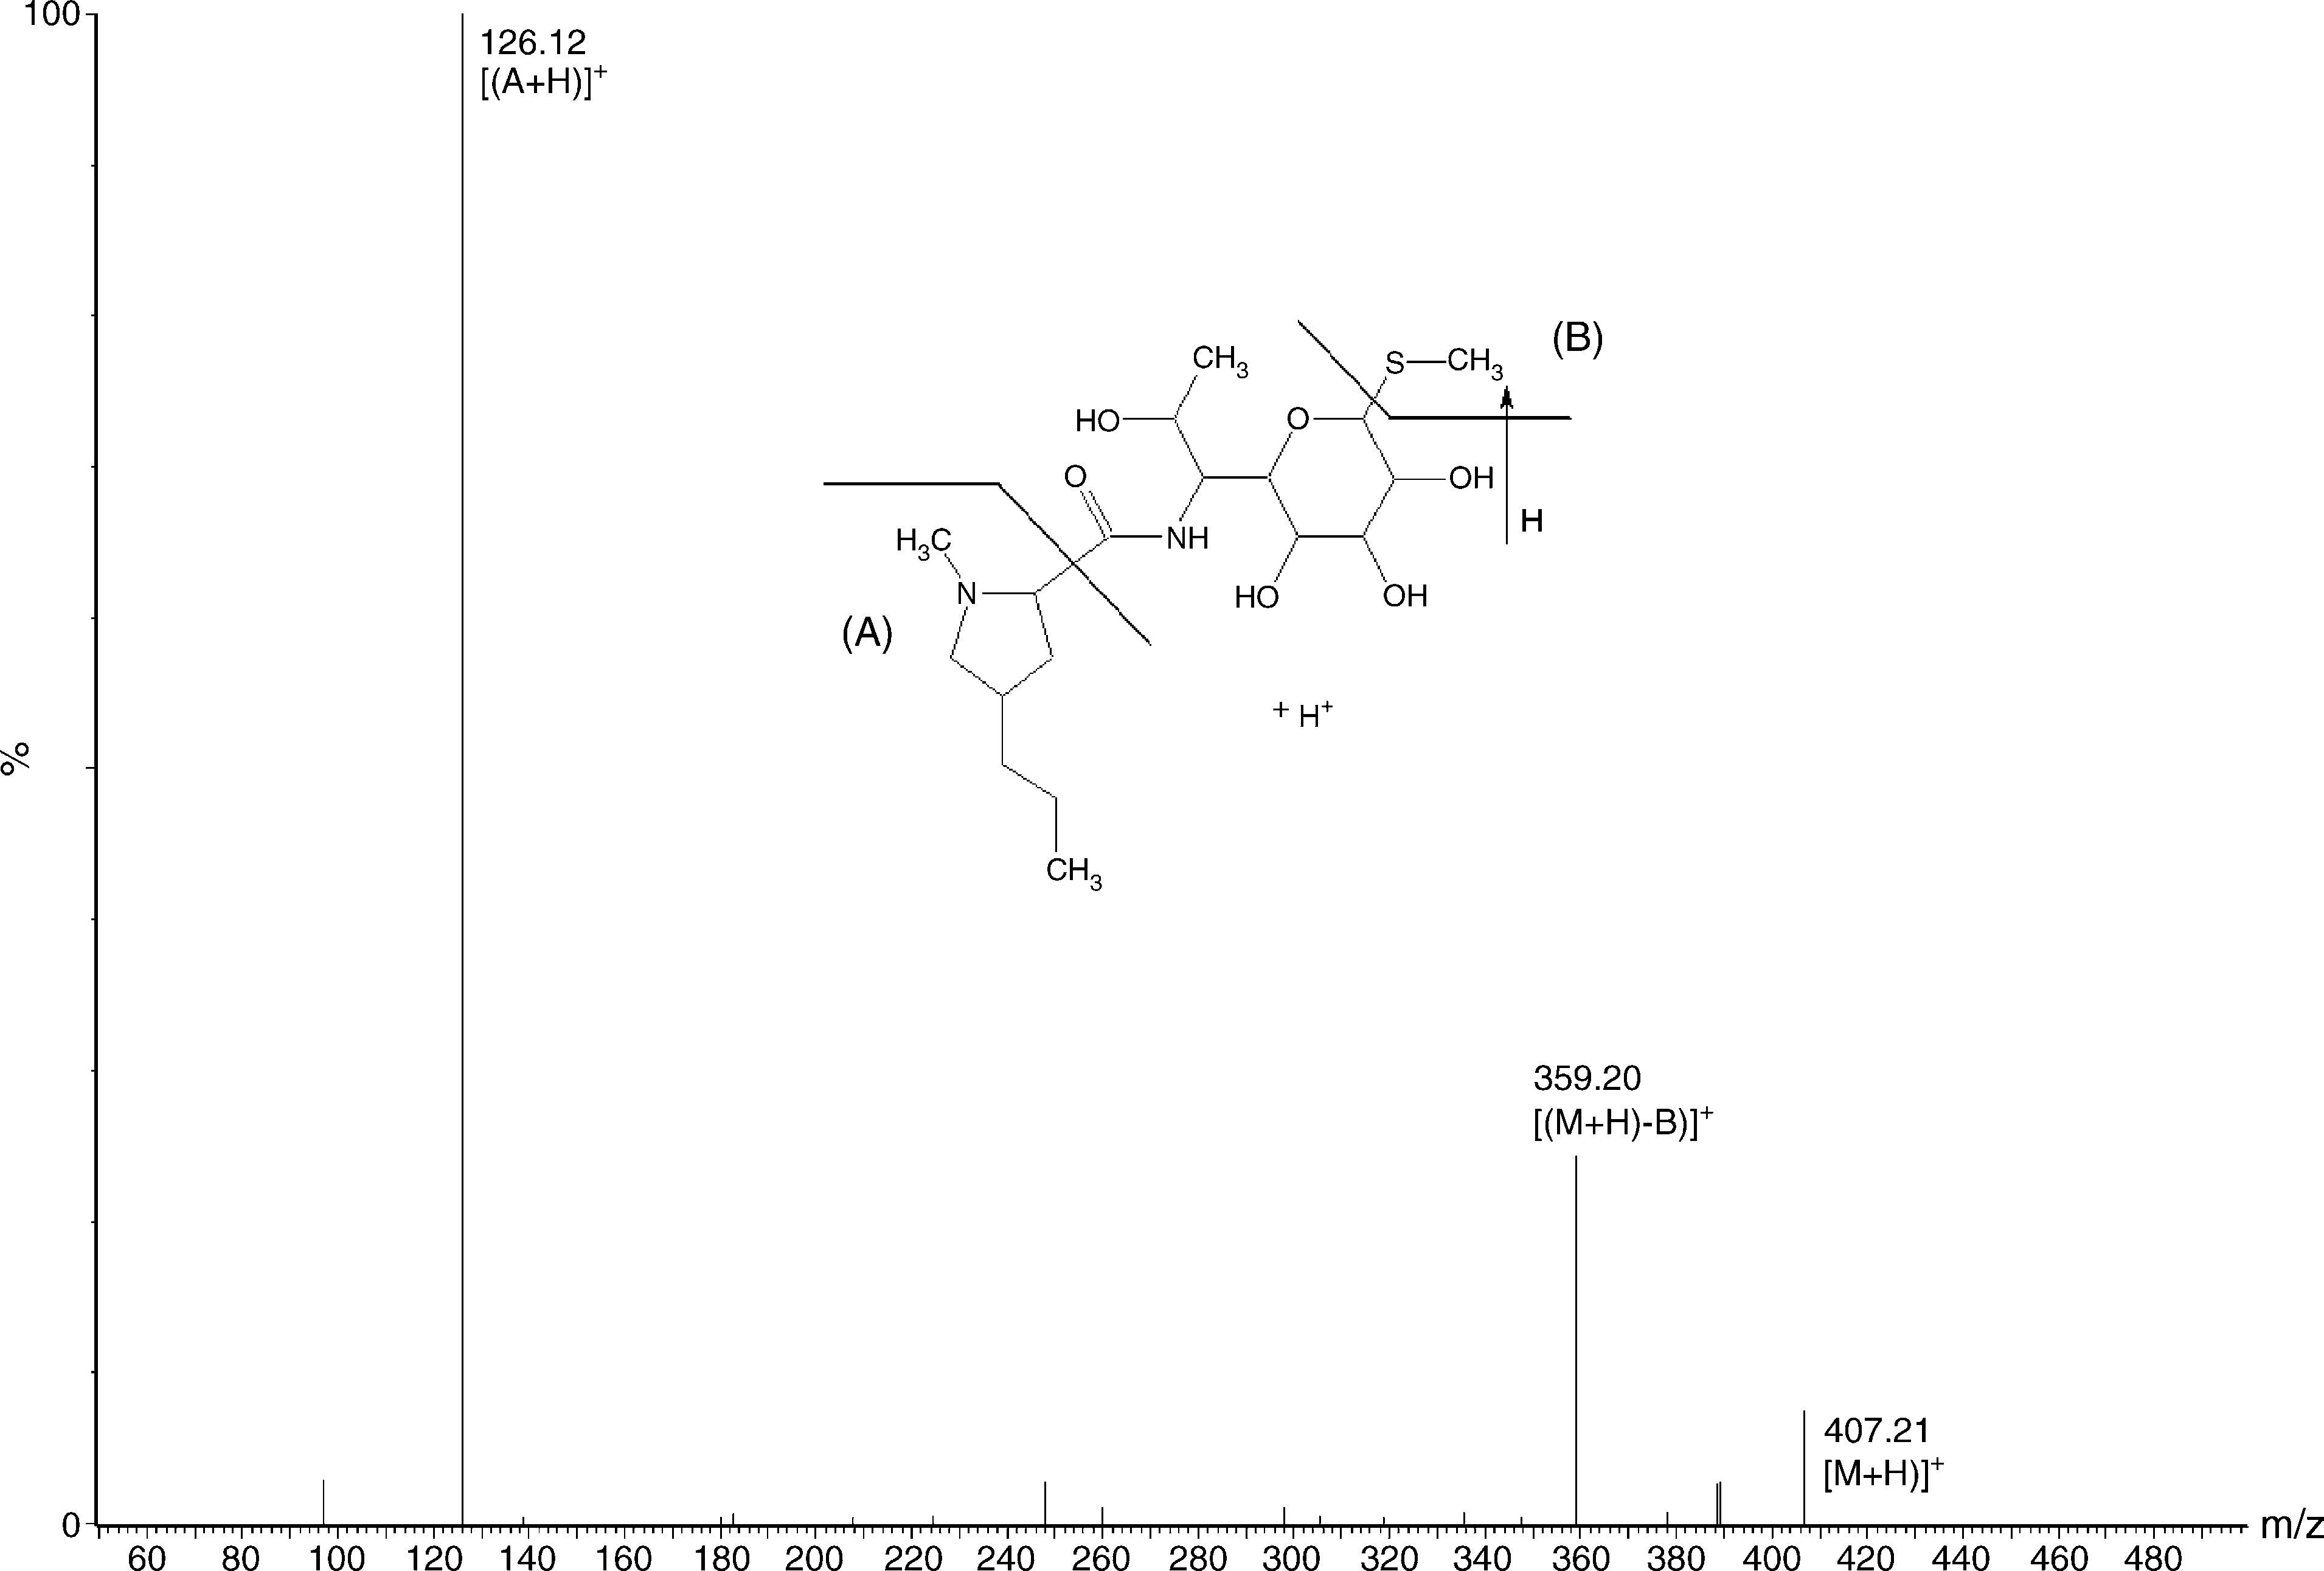 M. Douˇsa et al. / Journal of Pharmaceutical and Biomedical Analysis 40 (2006) 981–986
values with declared contents in samples obtained from three
In HPLC parameters we used same chromatographic col-
umn and composition of mobile phase as HPLC-UV method,we changed the flow rate to 0.5 ml min−1 because it is moreoptimal for ESI ionization and we decreased injection volume
to 5 l due the higher sensitivity of MS instrument.
M. Douˇsa et al. / Journal of Pharmaceutical and Biomedical Analysis 40 (2006) 981–986
values with declared contents in samples obtained from three
In HPLC parameters we used same chromatographic col-
umn and composition of mobile phase as HPLC-UV method,we changed the flow rate to 0.5 ml min−1 because it is moreoptimal for ESI ionization and we decreased injection volume
to 5 l due the higher sensitivity of MS instrument.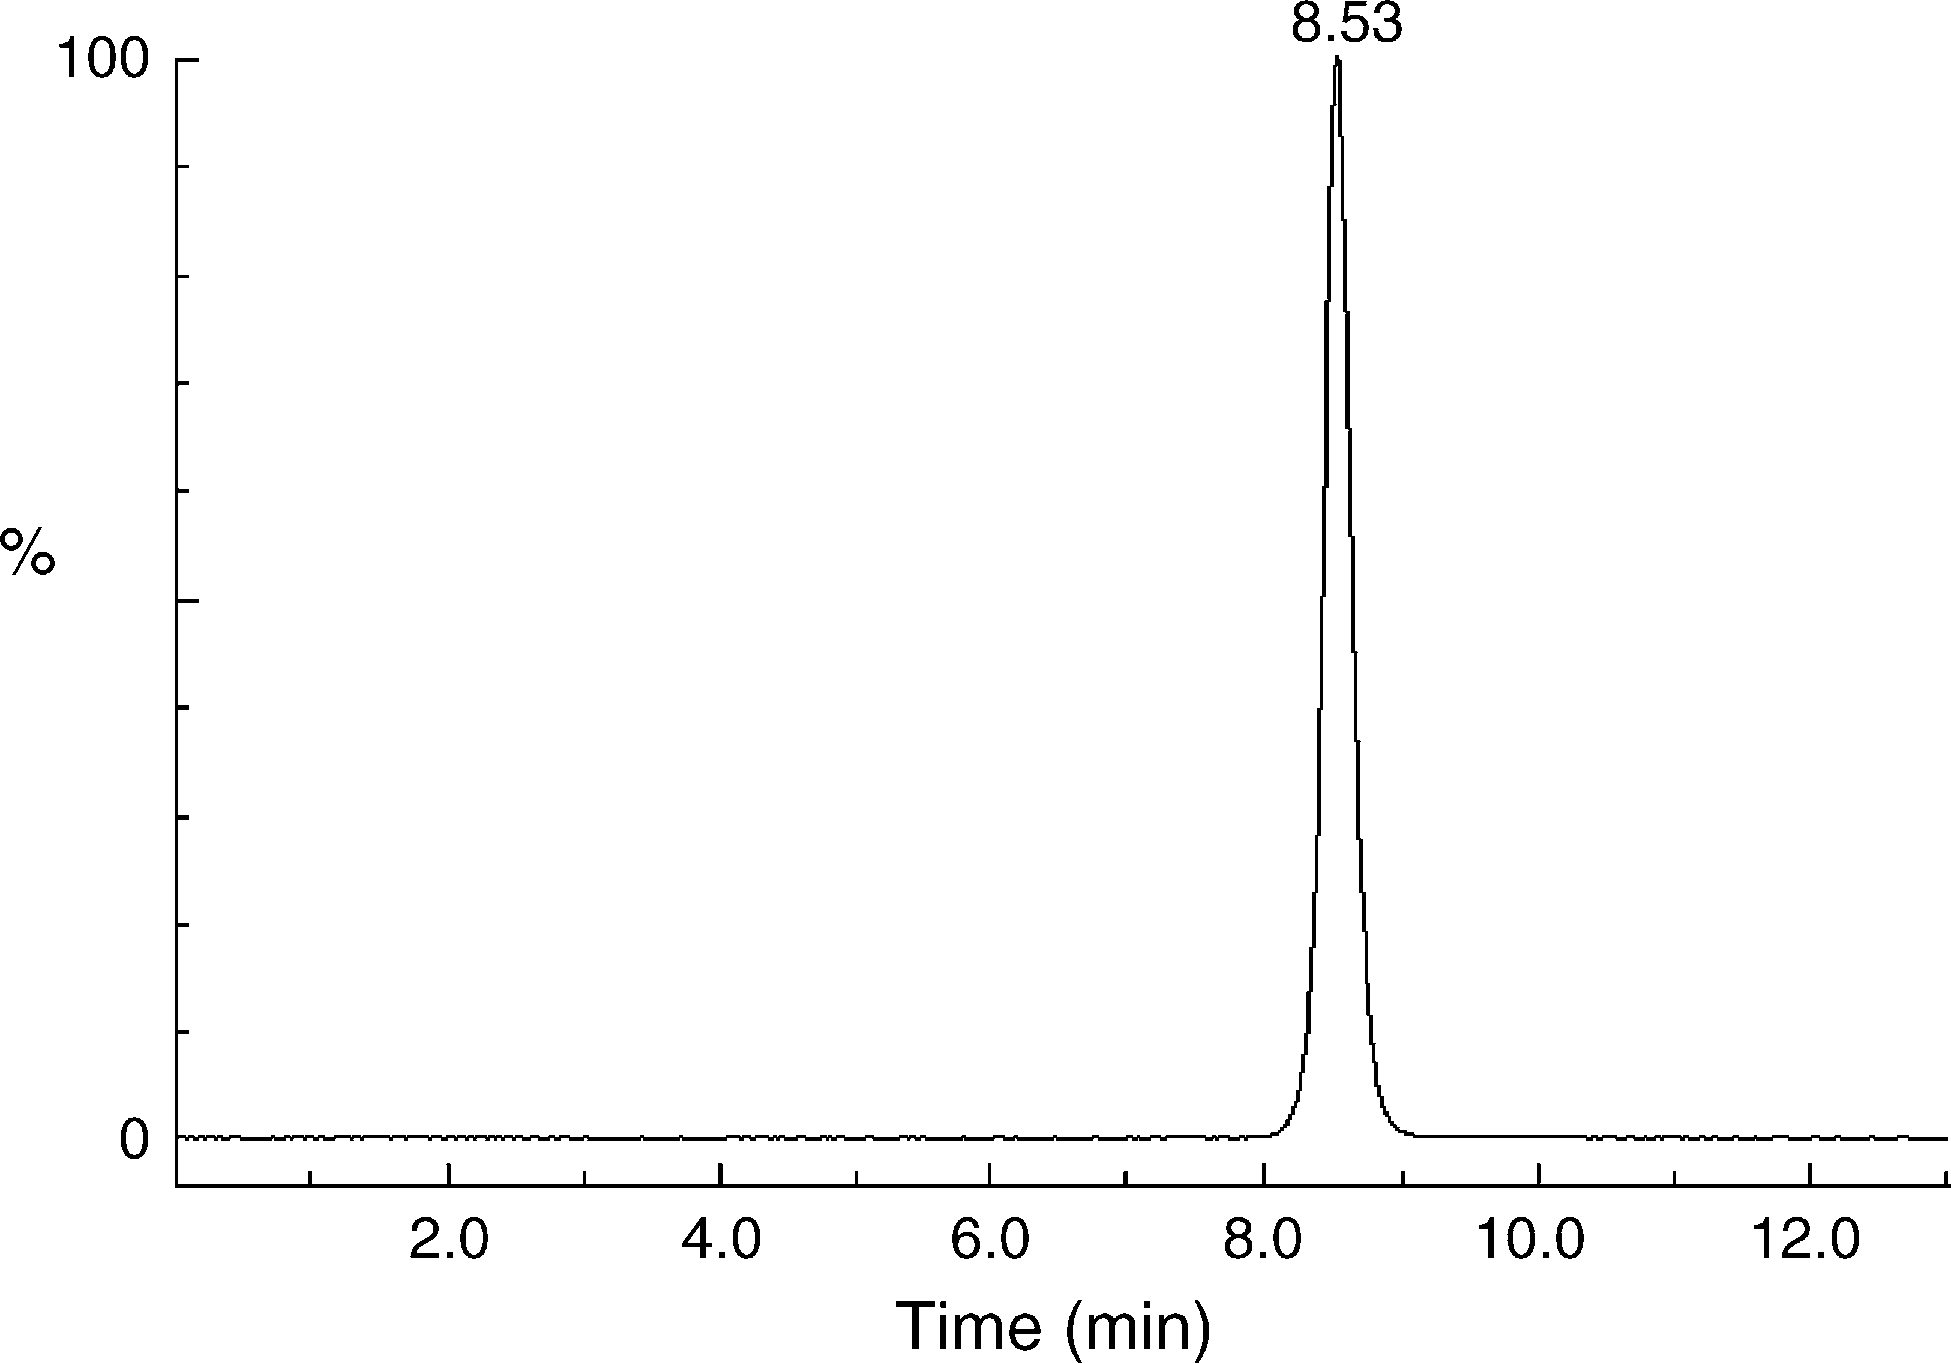 M. Douˇsa et al. / Journal of Pharmaceutical and Biomedical Analysis 40 (2006) 981–986
References
M. Douˇsa et al. / Journal of Pharmaceutical and Biomedical Analysis 40 (2006) 981–986
References